

The Evolution of Anglican Liturgy
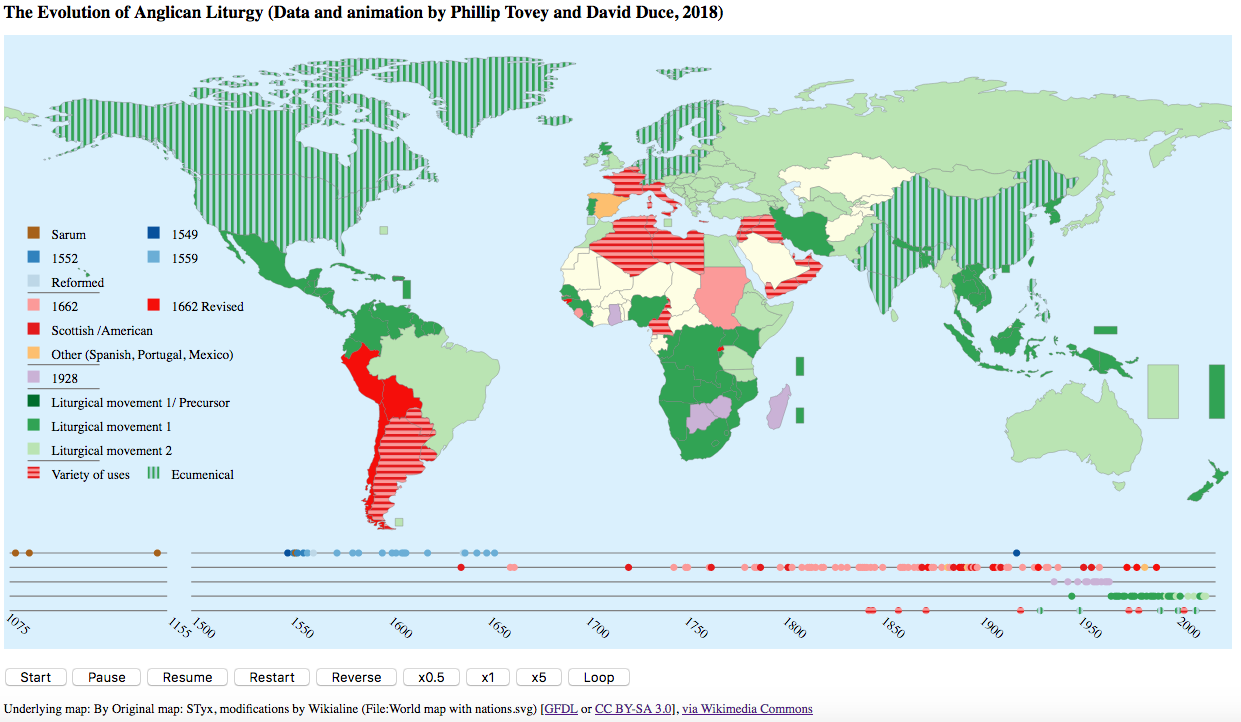
The history of Anglican liturgy and its spread across the Anglican Communion is complex. Two visualizations have been constructed to give an overview of key elements of this history. Each visualization consists of a world map and a timeline of events. Technically, the timeline visualization technique used is known as a faceted timeline, in this case five stacked timelines are used, one for each of five general categories of liturgies: pre 1662, 1662 and derived liturgies, 1928, products of the liturgical movement and mixed usages. Within each of the categories specific liturgies are identified by different colours, in the timeline and in the colouring of countries. The fifth category with types "variety of uses" and "ecumenical" is used for cases where no single liturgy predominates in a country or where there are strong ecumenical relationships, e.g. relating to the Porvoo agreement.
As the visualizations are an introduction it is important to recognize that there are uncertainties in the historical data on which this is based. The visualization does not attempt to represent uncertainty in the data. Furthermore, the world map data on which this is based reflects current country names and boundaries, which themselves have a history of evolution so do not necessarily represent names and borders at the time events occurred. For some parts of the world, the geography (especially Polynesia and Micronesia) is much more complicated than the resolution of the map allows. Bermuda, the Falkland Islands, Gibraltar, Hong Kong, Malta, Melanesia, Micronesia, Polynesia and the West Indies are beyond the resolution of the map, but given their importance, they have been represented by over-sized semi-transparent rectangles. The boundaries between England, Scotland and Wales are approximations, as are the boundaries between North and South India and North and South Tanzania.
We do hope that people will find these animations useful and that they will be valuable resources for educational purposes.
Note: for technical reasons the visualizations are best viewed in the Firefox web browser. Some will not work in current versions of Microsoft’s Internet Explorer or Edge web browsers.
The animated map (JavaScript animation)
This version of the animated map uses the Greensock gsap library (JavaScript), and should run in Edge etc. under Windows 10 and other browsers. bcp_gsap.html.
The control buttons are at the bottom of the screen.
The animated map (SVG and MP4 formats)
Technically, this version uses the animation capabilities of the W3C Scalable Vector Graphics Recommendation, but this aspect of SVG functionality is not available on all web browsers.
Click on the pink circle to start the animation. To restart the animation, first reload the web page (for example by typing ctrl/r)
The animated map is also available as a screen recording, with additional commentary, in MP4 format on Vimeo https://vimeo.com/297961277 and without the additional commentary at bcp_animation.mp4.
The interactive map
- Mouse over a country to see the events pertaining to that country
- Mouse over a circle on the timeline to see the events on that date
Screen shot
Screen shot of the map at the end of the animation (gsap version).
Phillip Tovey and David Duce (August 2018, revised November 2018)